Overview dashboard
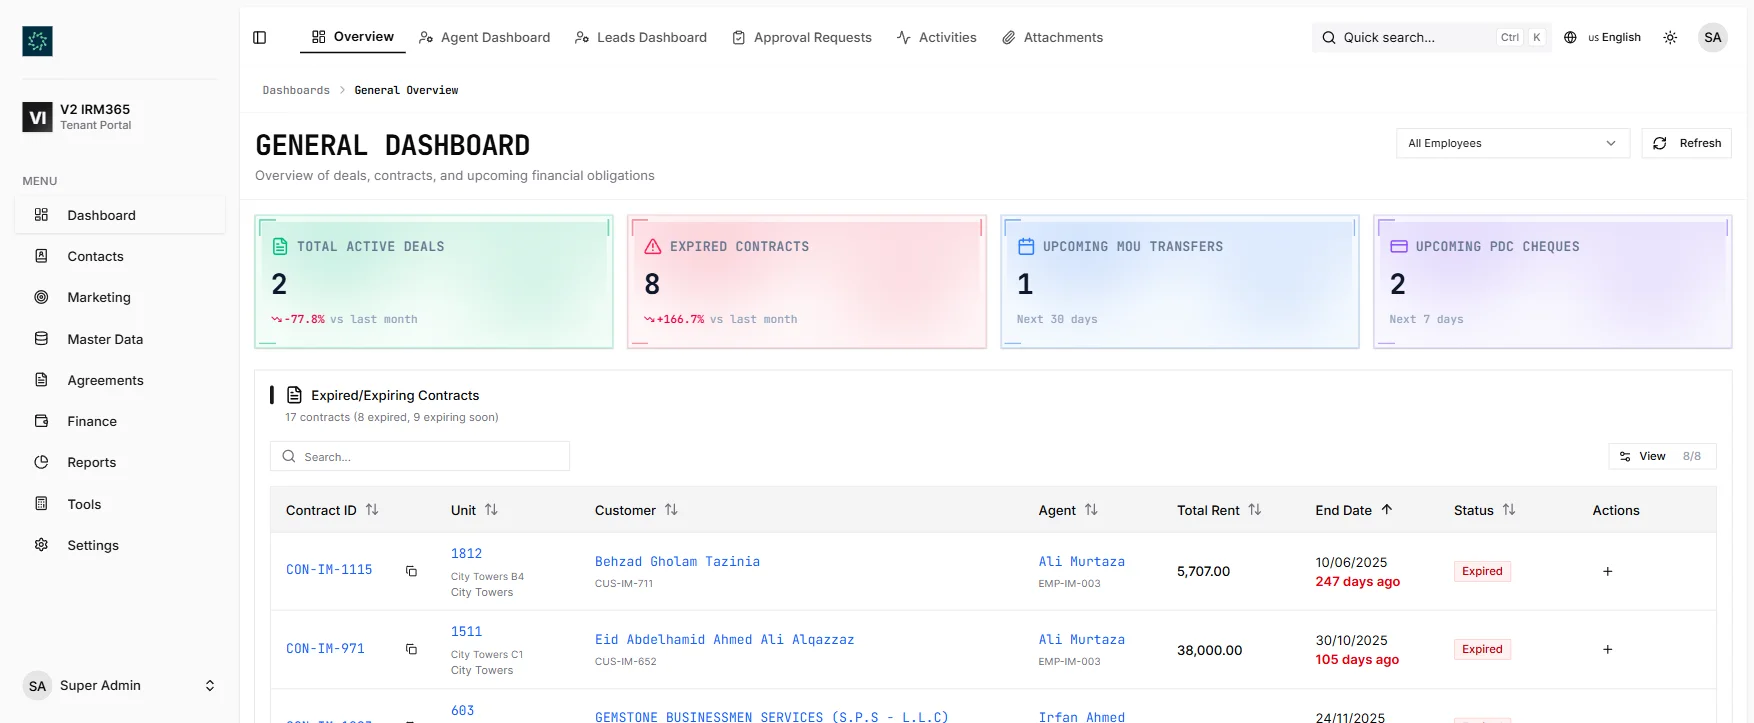
A company-level CRM dashboard for cash, pipeline, counts, activity stream, upcoming PDCs, and overdue receivables.
This real estate analytics dashboard shows the current pulse of cash, deals, leads, activity, PDCs, receivables, conversion, and team performance — then hands off to reports when teams need filtered, exportable detail.
A quick map before the detailed product proof. Jump to the area that matters most.
Cash position, active pipeline, customers, leads, contracts, recent activity, upcoming PDC cheques, and overdue receivables stay visible for managers and admins who need the big picture.
IRM365 dashboards are the live pulse of the business: Overview for company health, Deals for revenue, Leads for lead flow, and Activity for team behaviour. Which dashboard a user sees depends on permissions and role defaults.
Cash, pipeline, customers, leads, contracts, PDCs
Closed deals, pipeline value, commission mix
New, unassigned, funnel, sources, stale leads
Completion, overdue, outcomes, type mix
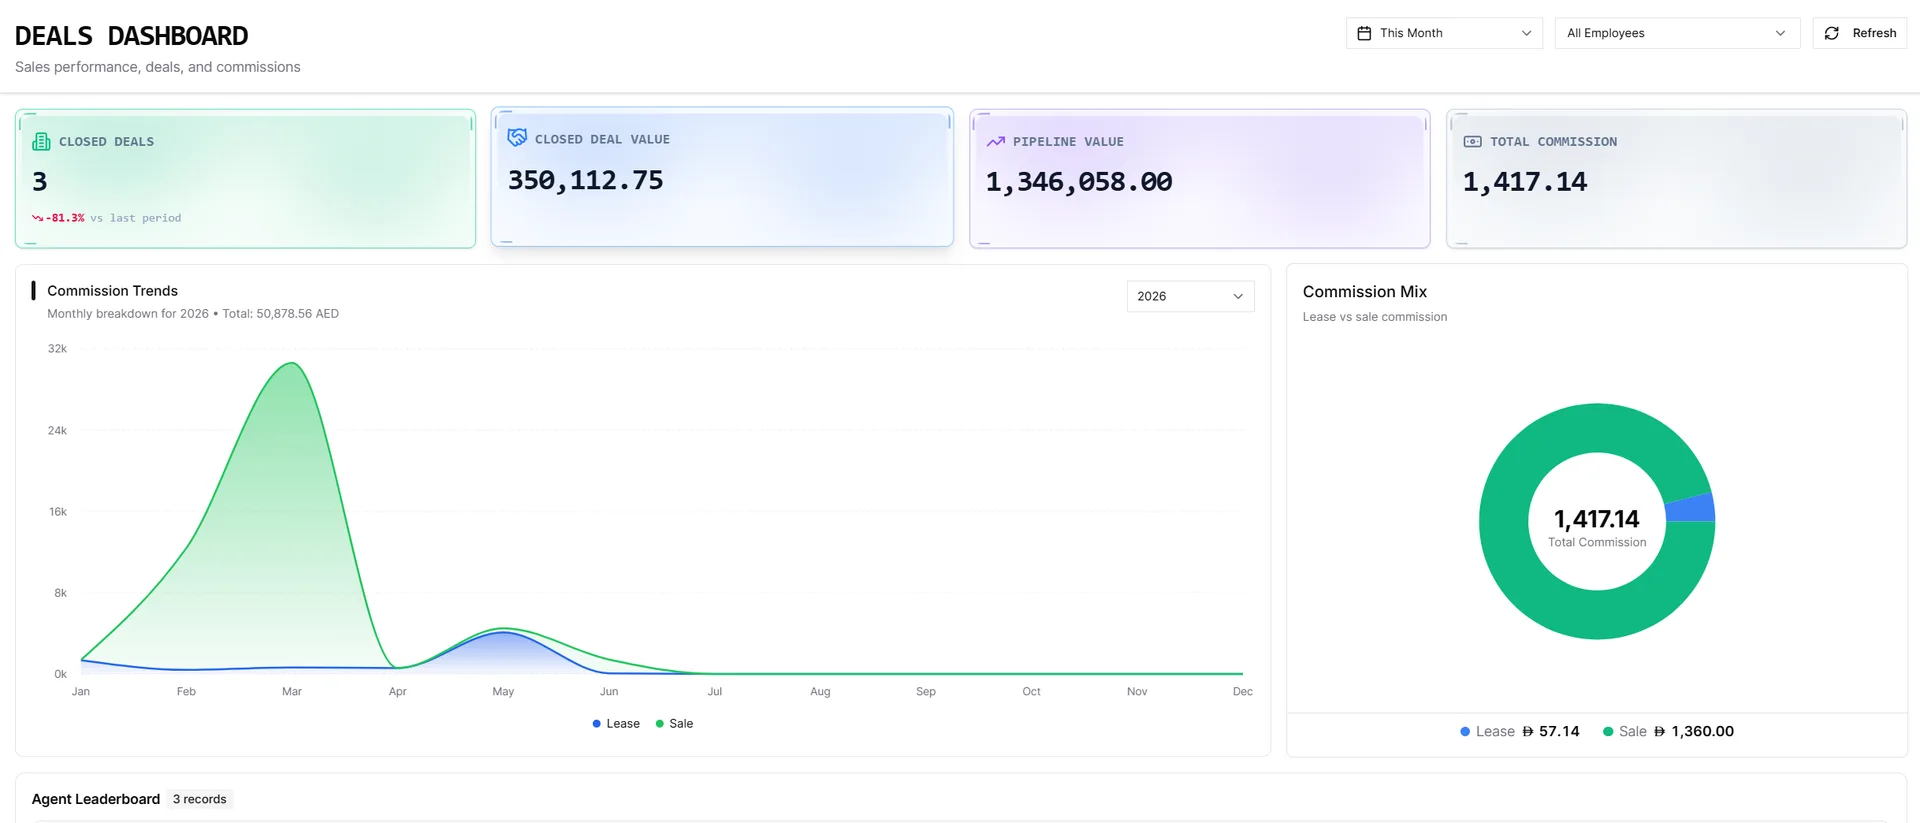
The Leads dashboard shows whether enquiries are moving through qualification and into opportunities. The Deals dashboard separates revenue tracking from activity tasks, with closed deal value, pipeline value, commission totals, deal types, and agent scope controls.
The Activity dashboard is the behavioural view: total activities, completion rate, overdue work, average time to complete, quality rates, volume over time, outcome mix, activity type mix, and a per-agent activity leaderboard.
Dashboards are for live pulse and drill-down. Reports are read-only, pre-formatted analysis pages for money, schedule, and performance data, with filters, paginated tables, column visibility, and export where supported.
Excel or PDF depending on report.
Dashboards are role-scoped operational views; reports remain the exportable analysis layer for finance, schedules, and performance.
A company-level CRM dashboard for cash, pipeline, counts, activity stream, upcoming PDCs, and overdue receivables.
A sales dashboard for closed deals, closed value, pipeline value, commission mix, deal types, and per-agent leaderboard.
A lead dashboard for lead-flow metrics, unassigned queue, conversion funnel, source performance, stale leads, and score distribution.
Completion, overdue work, outcome mix, activity types, quality rates, and activity leaderboard.
Dashboard filters and date ranges are remembered per user; most widgets refresh on page load.
Drill from dashboard pulse into filtered report/list views when you need exportable detail.
IRM365 modules are connected. Explore the next capabilities that usually sit beside this feature in a real brokerage workflow.
Join UAE real estate teams who run their entire business — leads, deals, contracts, and finance — from one platform. No annual contract.